

Technology for a Better World
Personalizing Game Spaces Based on Individual Visual-Motor Skills
Master Thesis
Research Focus:
This study focuses on the fundamental challenge that the difficulty of a game can be perceived differently resulted by the skill difference among players. We aim to provide personalized game designs based on individuals' visual motor integration skill from the initial stage, so that individuals can perform the score the designer intended.

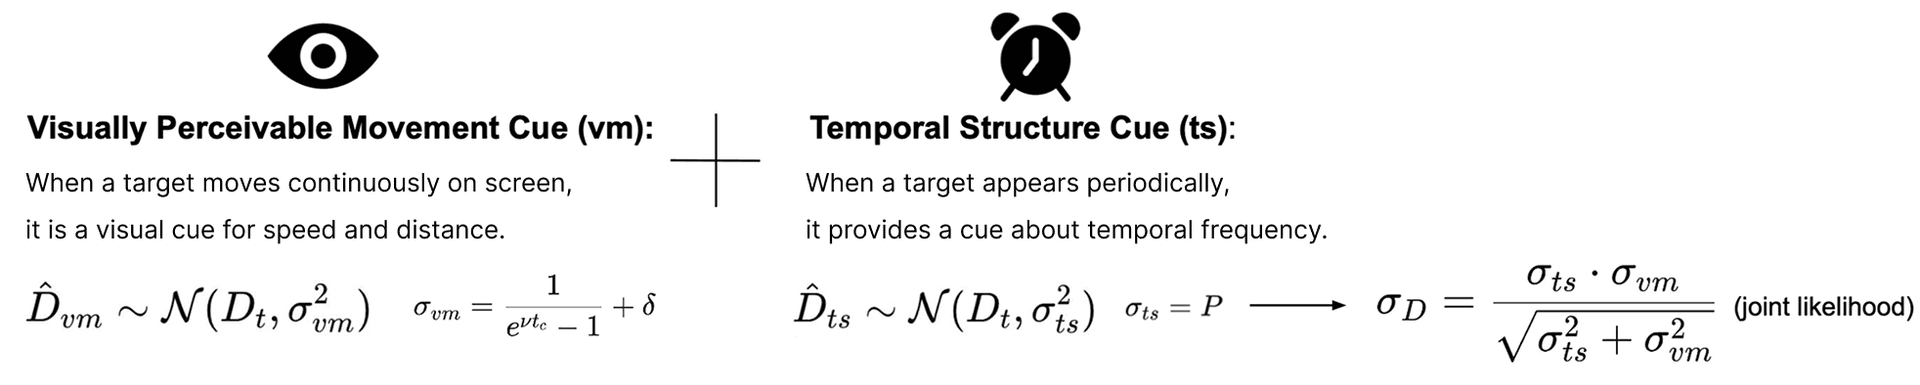
Our approach is built on a novel difficulty balancing technique that uses the Moving Target Acquisition (MTA) model. The MTA model is a cognitive model that describes how players predict a target's arrival by integrating multiple sensory cues. As its formulation shows, it optimally combines the Visually Perceivable Movement Cue (information from the target's continuous movement and speed) with the Temporal Structure Cue (information from the target's repetitive appearance period).
This model allows our technique to work in three steps:
- Measure Skill: We first use a standard MTA task to measure a player's individual cognitive parameters (their intrinsic visual motor integration skill)
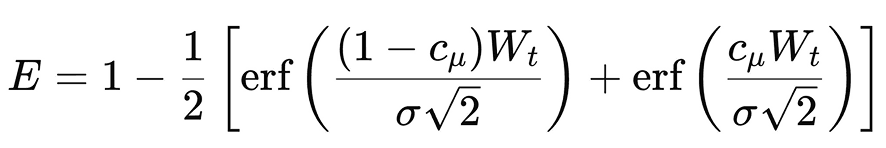
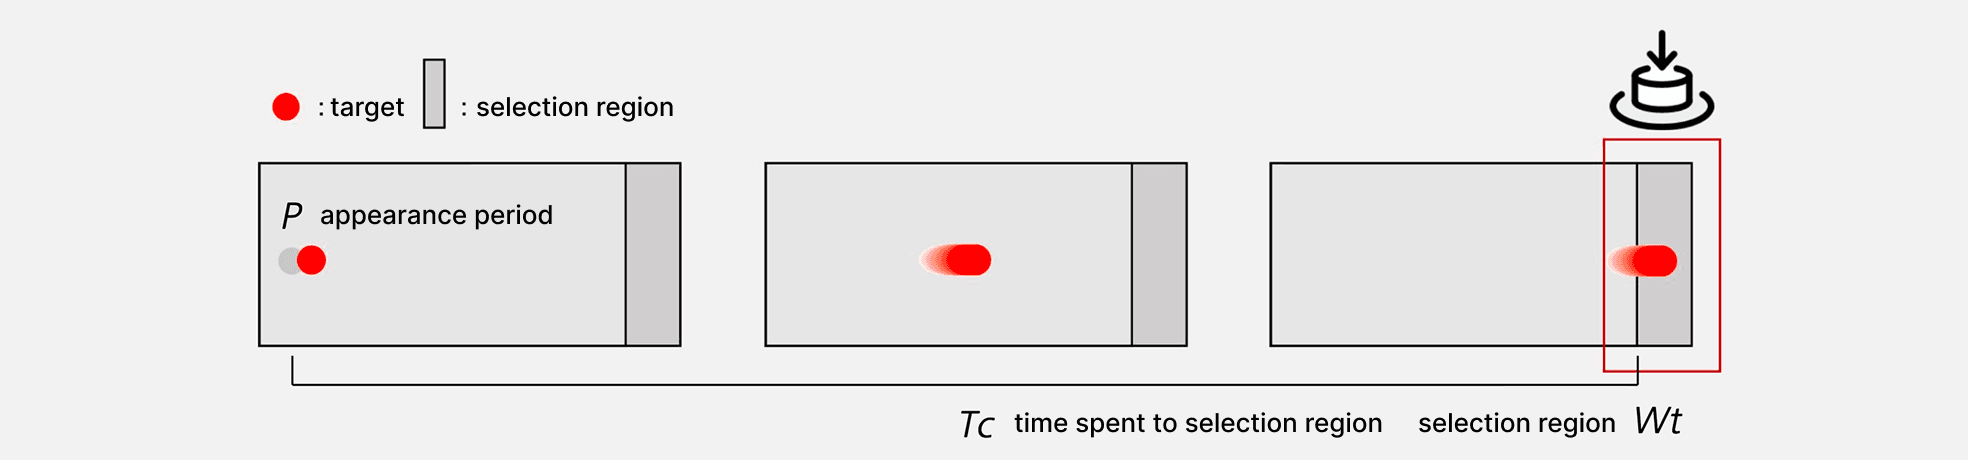
- Predict Performance: Because the game's own design parameters (such as $P$ - period, $T_c$ - cue time, $W_t$ - target time) are also inputs to the MTA model, we can use the player's cognitive parameters to accurately predict their error rate for any specific game design.
- Balance Difficulty: Taking advantage of this predictive power, we then automatically adjust the game's design parameters ($P$, $T_c$, $W_t$) until the predicted error rate matches the target error rate intended by the designer.
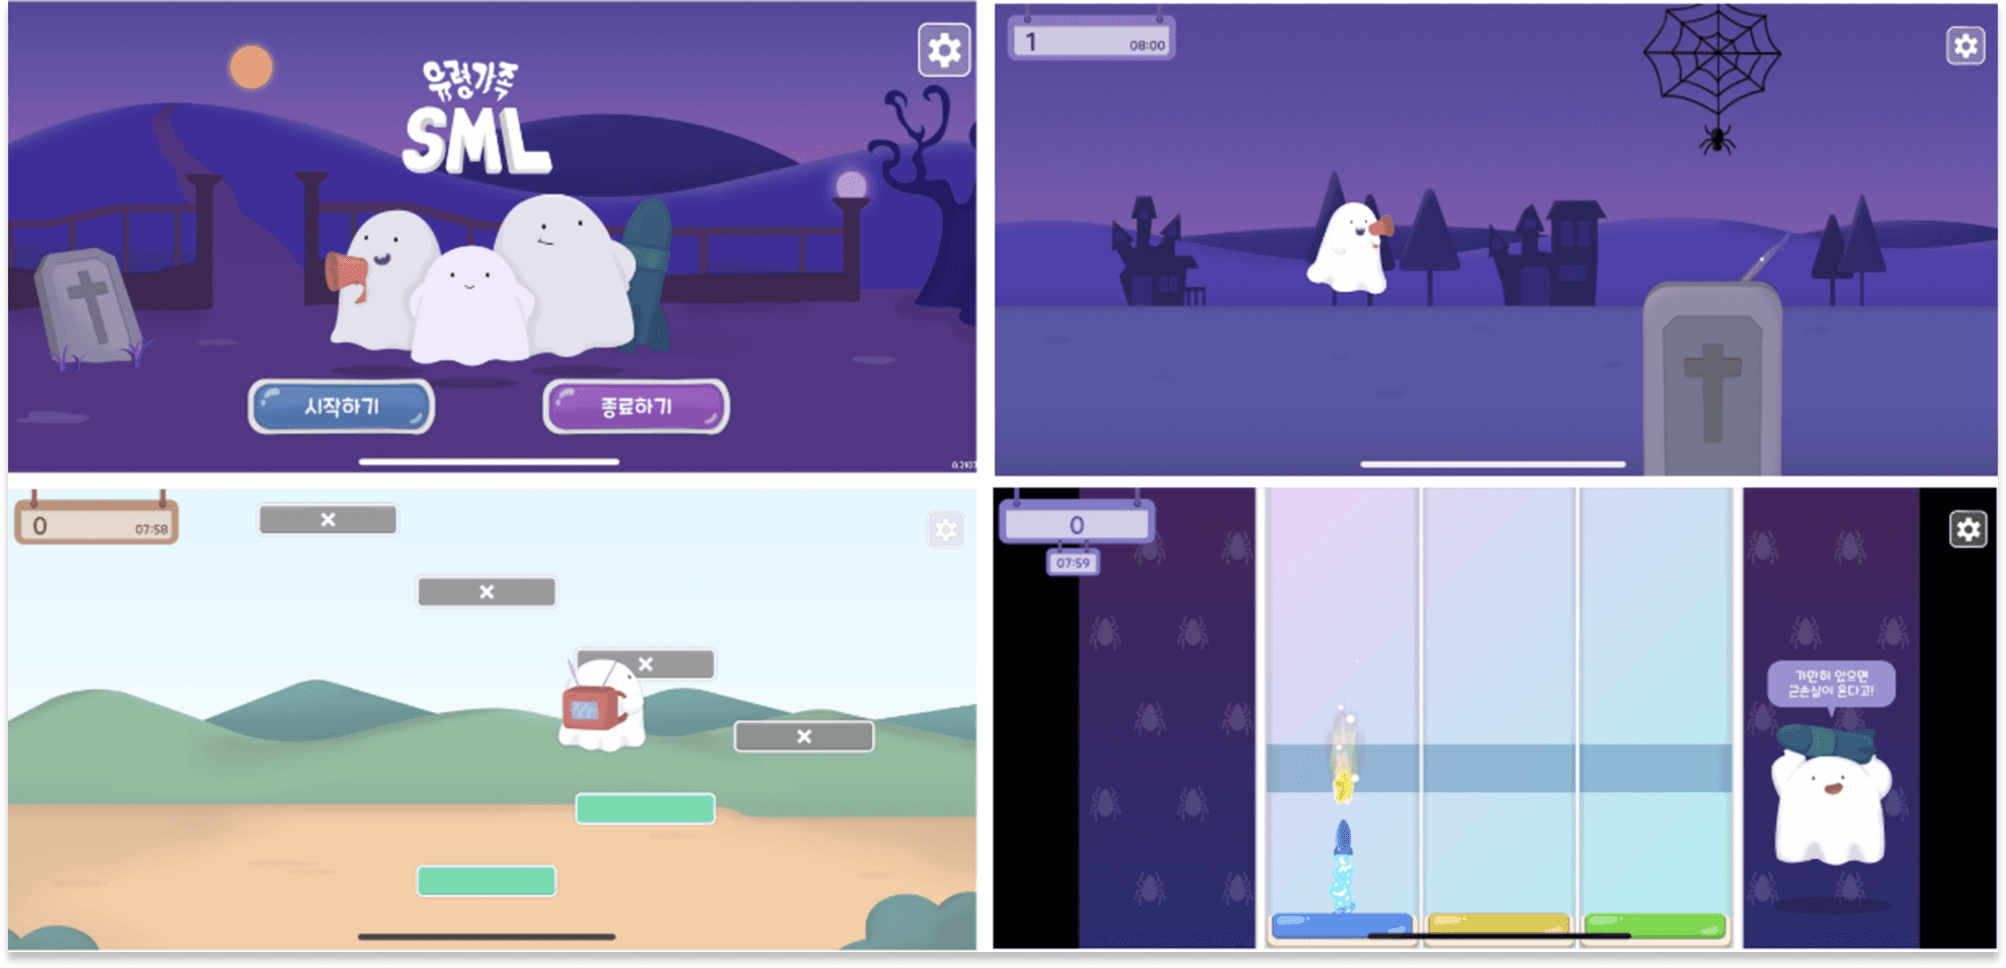
To verify our idea, we developed a game called SML, consisting of three different games, and applied the difficulty balancing technique. For the experiment, each player played both the personally designed version and the one designed for average skill.
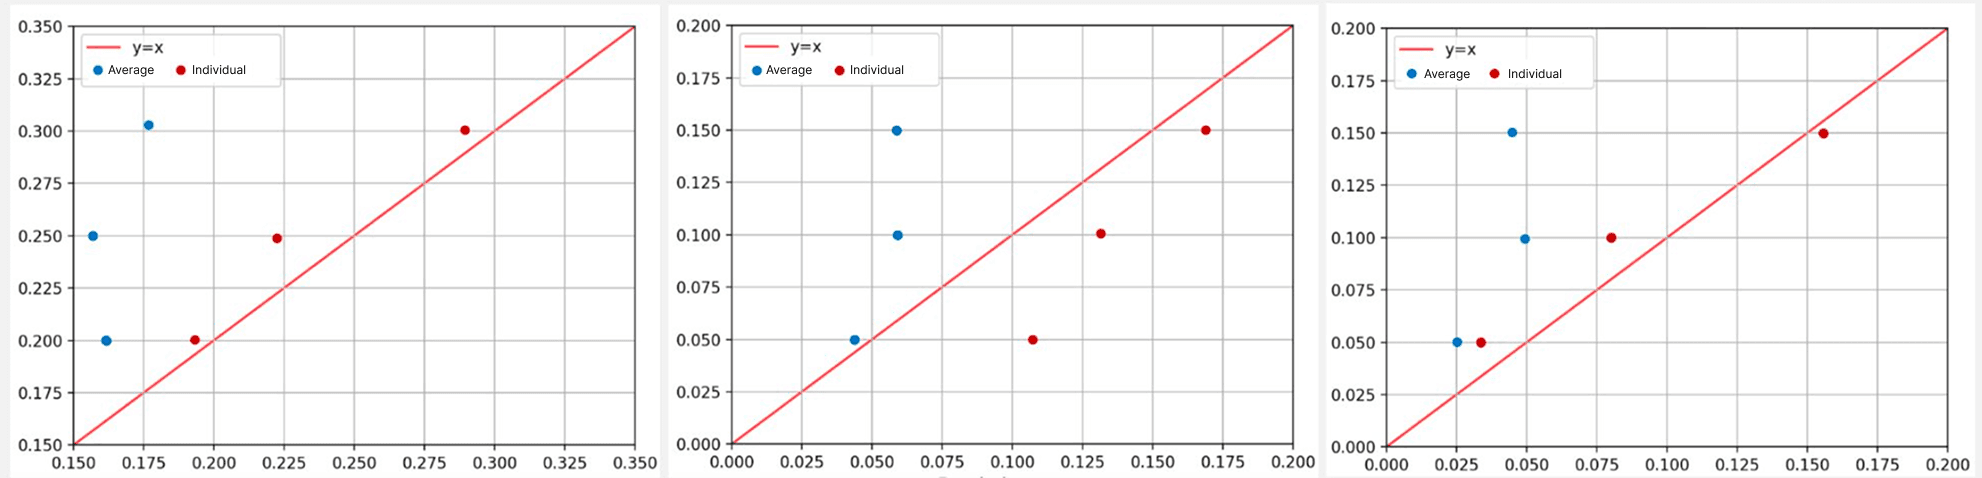
As a result, we were able to observe that the game with the personalized design was played as intended by designers; the actual error rate was remarkably similar to the target error rate. However, the game experience of players, observed through a survey, revealed an interesting finding. Players rated the "average design" version, which was objectively easier for them, as more immersive and challenging. This suggests a complex relationship exists between the error rate as an objective metric and the perceived difficulty of the player.